Acoustics

- Font size: Larger Smaller
- Hits: 4755
- 0 Comments
- Subscribe to this entry
- Bookmark
The largest daily migration happens here in the ocean. Millions of zooplankton and other small marine life travel up from the depths at night to feed on phytoplankton. At daylight they travel back down to the depths to keep them safe from predators. Fish and crustaceans that feed on the zooplankton also travel up and down with this cycle in search of food. Two of the scientists on board, Dr. Joe Warren and Dr. Kevin Boswell use hydroacoustics to help gather data and track this daily migration.
Several student questions were posted on an earlier blog entry about the pictures created from the acoustic data from the sound waves sent down into the water. Here is a little more information about how that works, why it is done and what the data look like.
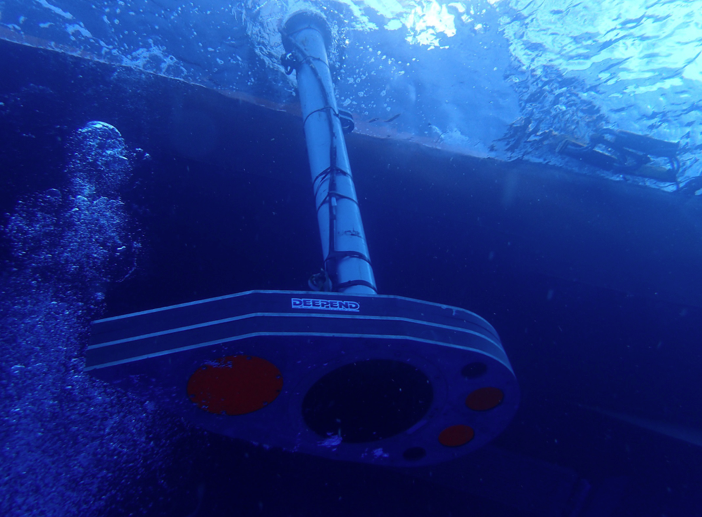
When the ship reaches a station, the location where the scientists want to collect their data, the acoustic transducer is lowered into the water. The transducer acts like a “telescope” underwater by sending sound waves down. These sound waves bounce off of the layers of animals and create picture of the layers of animals. The transducer boom is always transmitting from a fixed location. However to gather more detailed information at different depths the scientists can use an additional transducer.

Attaching the wombat.
The autonomous echo sounder system (referred to here as wombat) is attached to the CTD rosette to collect data from the different layers of the ocean. With the system attached to the CTD it can be lowered by the ship’s winch to the desired depth to gather information. This allows the scientists to get a close up of the organisms and you can even see individual items in the water column.

Here is another picture of the data sample.

In this photo you can see on the graph the abundance levels of the organisms with red being the most concentrated and blue being the least concentrated. Also included in this graph are the sampling depths of the MOCNESS and the depth/range of the “wombat”. Notice the abundance of the organisms at the surface peaks at night and decreases during the day. This is visible in both of the above images.
The scientists also correlate the data that they collect by determining the density of different organisms in the lab. The density of the animals can vary due to the presence of swim bladders or lipids. They test multiple numbers of a species for verification and record the data in their science science log.

Dr. Joe Warren performing the density calculations.
All of the acoustic information is used in combination with the collected samples to better understand the dynamics and biology of the ocean.
Teacher At Sea,
Christia Hewlett
Author's recent posts


